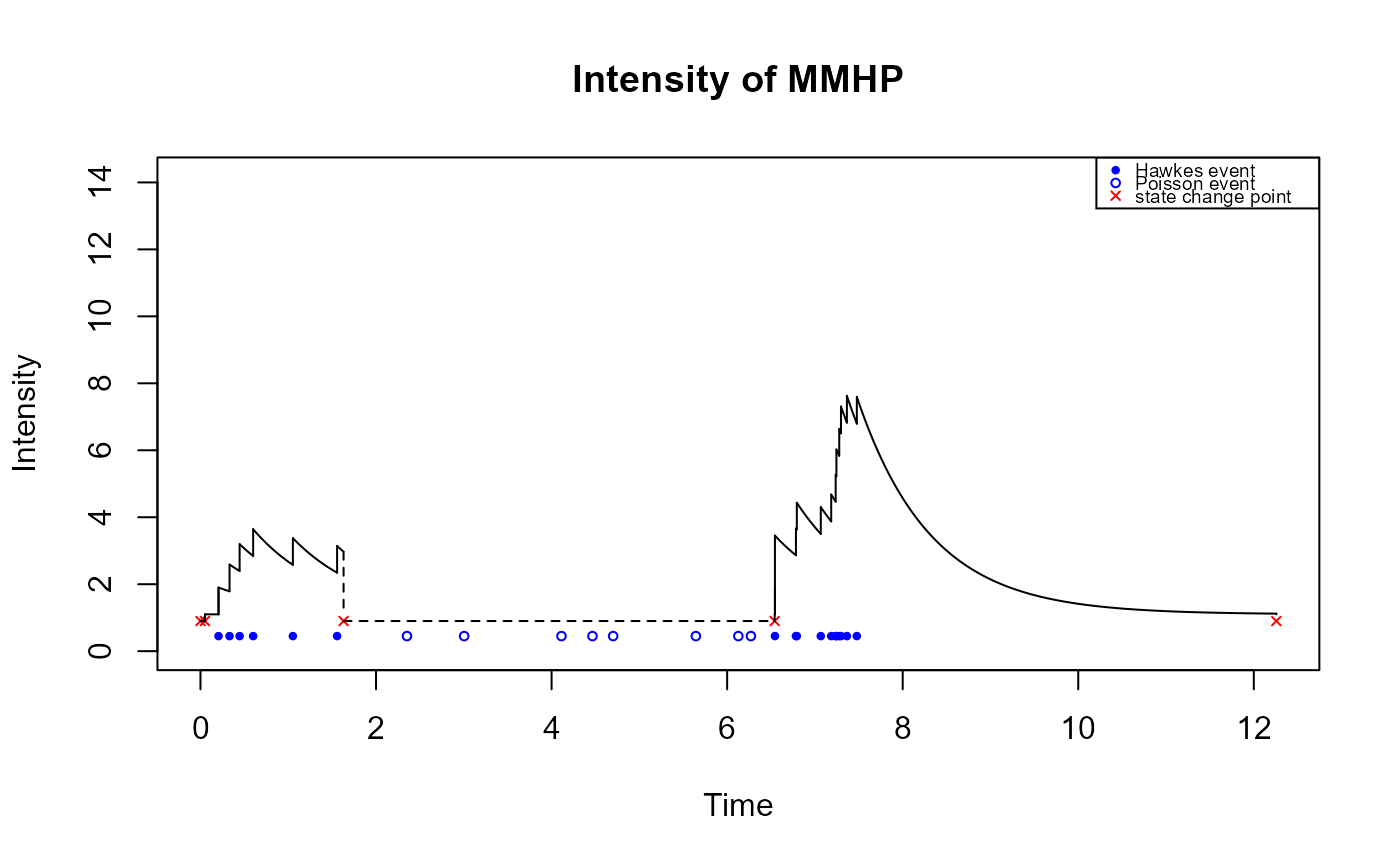
Draw the intensity of the Markov-modulated Hawkes Process(MMHP)
Source:R/drawUniMMHPIntensity.R
drawUniMMHPIntensity.RdTake a mmhp object and draw its intensity accordingly
drawUniMMHPIntensity(
  mmhp,
  simulation,
  int_title = "Intensity of MMHP",
  leg_location = "topright",
  color = 1,
  add = FALSE
)
Arguments
| mmhp | a mmhp object including its state, state_time, events, lambda0, lambda1, beta and alpha. |
|---|---|
| simulation | the simulated Markov-modulated Hawkes Process(MMHP) |
| int_title | title of the plot. |
| leg_location | location of legend, if moving needed |
| color | A specification for the default plotting color. |
| add | logical; if TRUE add to an already existing plot; if NA start a new plot taking the defaults for the limits and log-scaling of the x-axis from the previous plot. Taken as FALSE (with a warning if a different value is supplied) if no graphics device is open. |
Value
no return value, intensity plot of Markov-modulated Hawkes process
Examples
Q <- matrix(c(-0.4, 0.4, 0.2, -0.2), ncol = 2, byrow = TRUE)
x <- pp_mmhp(Q,
  delta = c(1 / 3, 2 / 3), lambda0 = 0.9, lambda1 = 1.1,
  alpha = 0.8, beta = 1.2
)
y <- pp_simulate(x, n = 25)
drawUniMMHPIntensity(x, y)