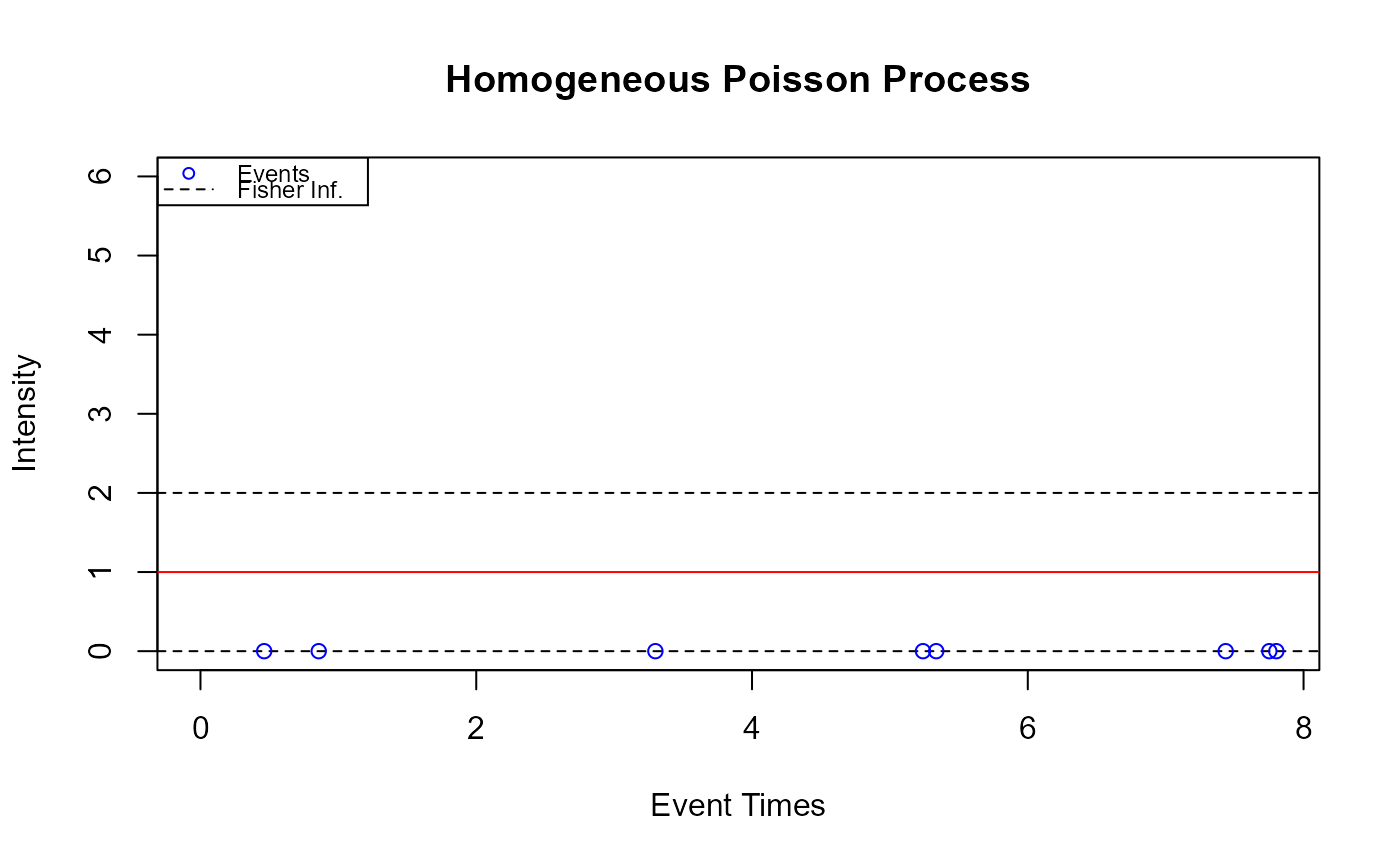
Draw the intensity for a homogeneous Poisson process
drawHPPIntensity(
  hpp = NULL,
  events,
  int_title = "Homogeneous Poisson Process",
  start = 0,
  end = max(events),
  color = "red",
  plot_events = TRUE,
  fit = FALSE,
  add = FALSE,
  verbose = FALSE
)
Arguments
| hpp | object for homogeneous Poisson process |
|---|---|
| events | event times input |
| int_title | the plot title |
| start | start of events |
| end | end of events |
| color | a specification for the default plotting color. |
| plot_events | a boolean indicating whether input events will be plotted |
| fit | a boolean indicating whether to fit a hpp or use the passed object |
| add | whether to add the hpp intensity to an existing plot |
| verbose | whether to output informative messages as running |
Value
no return value, intensity plot of homogeneous Poisson process