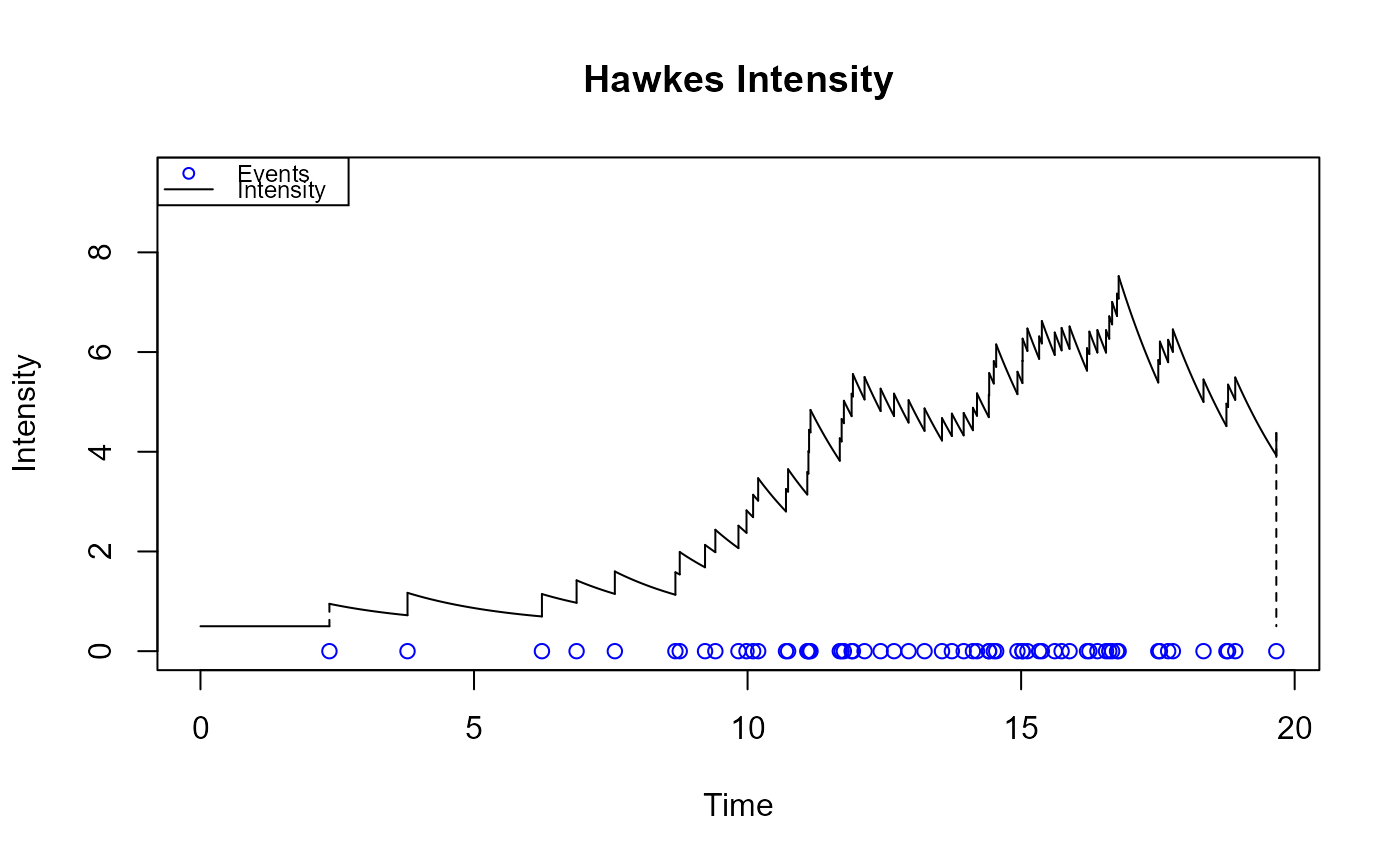
Draw the intensity of a Hawkes Process
drawHPIntensity(
  hp = NULL,
  events,
  int_title = "Hawkes Intensity",
  start = 0,
  end = max(events),
  history = NULL,
  color = 1,
  i = 1,
  add = FALSE,
  fit = FALSE,
  plot_events = TRUE,
  verbose = FALSE
)
Arguments
| hp | object parameters for Hawkes process. |
|---|---|
| events | the event times happened in this state |
| int_title | title of the intensity plot |
| start | the start time of current state |
| end | the end time of current state |
| history | the past event times |
| color | specify the default plotting color. |
| i | state number, used only for drawUniMMHPIntensity |
| add | whether to add the hawkes intensity to an existing plot, used for drawUniMMHPIntensity |
| fit | a boolean indicating whether to fit a new HP to events |
| plot_events | indicate whether events will be plotted |
| verbose | whether to output informative messages as running |
Value
no return value, intensity plot of Hawkes process
Examples
set.seed(100)
hp_obj <- pp_hp(lambda0 = 0.5, alpha = 0.45, beta = 0.5)
events <- pp_simulate(hp_obj, start = 0, end = 20)
drawHPIntensity(hp_obj, events)